' fill='none' stroke='%23304560' stroke-miterlimit='10' stroke-width='2'/%3e%3c/svg%3e)

Top 5 Must-Have Features for Effective Statistical Analysis
Dr. Vanessa Cave
25 June 2024
Effective statistical analysis demands a powerful toolset that combines data visualization, robust data handling, cutting-edge methods, user-friendliness, and reproducibility. This blog explores the top 5 features that enable researchers to extract maximum value from their data.
1 - Impactful Graphics
Graphs play a vital role in statistical analysis. They are used to:
- Check data for anomalies or errors
- Explore data, including the relationships between the variables
- Communicate the results of an analysis
Graphs are a key component of statistical analysis, enabling data to be visualized and summarized. Prior to statistical analysis, graphs are extremely useful for checking and examining the data, allowing unusual observations, such as outliers or typographical errors, to be identified and, where possible, corrected. Furthermore, the use of graphs to explore data can reveal relationships between variables and help guide the selection of an appropriate statistical model. Then, following a statistical analysis, graphs provide an effective tool for conveying information on the results of the analysis in a compact and easily accessible format, reducing or removing the need for lengthy explanations.
What does Genstat offer?
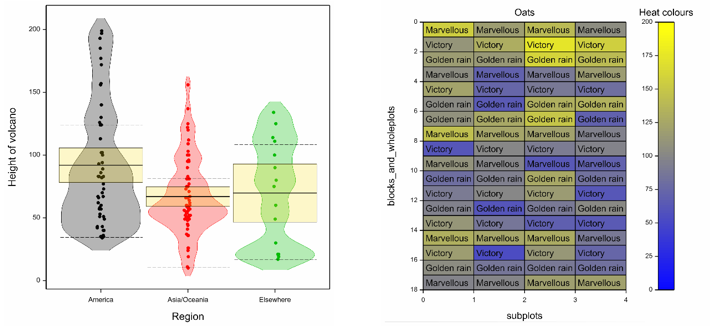
Genstat offers a comprehensive suite of graphical tools that we’ve further enhanced in our latest release. For example:
- It is now even easier to customise colours and take control of text size, font, and style.
- You can now add pirate plot features (means, medians, percentiles, confidence limits and jittering) to 1D density plots (i.e., Violin plots).
- The visualization of a variate over 2 dimensions has been made even easier by the addition of a new menu for creating heatmaps
2 - Powerful Spreadsheet Facilities
Data provides the raw information that’s statistically analysed to uncover trends, relationships, patterns, and other valuable insights.
When conducting an experiment or survey, the data collected must be stored in an accessible and appropriate format for subsequent statistical analysis. Analysts also often need to be able to manipulate their data to facilitate analysis. Spreadsheets provide an easy-to-use tool for storing and manipulating data. They are used to:
- Store, define and validate data
- Sort and filter data to identify specific pieces of information
- Combine data from multiple sources
- Select a subset of data relevant to the current analysis
- Reshape data (e.g., stack or unstack) into a form convenient for analysis
- Calculate or recode data
What does Genstat offer?
Genstat has extensive and powerful spreadsheet facilities for data entry, import, export, and manipulation. This includes menus to calculate new columns of data, and in Genstat 24 a new menu has been added so that you can easily create a column of lagged values or differences.
3 - Leading-Edge Statistical Methods
To uncover valuable insights and make informed decisions, data must be appropriately analysed using powerful and reliable methods.
The purpose of statistical analysis is to extract meaningful insights from data. However, the results, inference and conclusions from a statistical analysis are only meaningful if an appropriate method has been used. Furthermore, often there is a choice of valid statistical approaches; however, some approaches will be more powerful, more precise, or more reliable than others. What’s more, statistics is always evolving, with new methodology continuously being developed that offer improvements over existing techniques or address a previously unsolved problem.
What does Genstat offer?
Genstat provides extensive data analysis facilities, delivering reliable and insightful results no matter how complex your data may be. Our latest update provides even more functionality, including:
- The ability to analyse censored data using ANOVA and regression
- 2-dimensional spline models (i.e., LVIS and SpATS) for modelling spatial correlation
- Tools to design and analyse n-of-1 medical trials

4 - User-friendly tool
Most research relies on statistical analysis. However, many researchers struggle with the data analysis stage due to both its complexity and “unfriendliness” of statistical software tools.
Statistical analysis can be very challenging! Not only is there a vast range of techniques, methods and models, but an advanced or specialised procedure may be required to deal with complex data or an unusual problem. What’s more, it can be very easy to get things wrong and inadvertently perform an invalid statistical analysis. To make statistical analysis methods accessible, easy-to-use tools are required to guide users through the correct and efficient use of statistics.
What does Genstat offer?
Genstat’s user-friendly menu interface provides all the standard statistical analyses, as well as many advanced techniques. Each new version of Genstat sees new menus being added and existing menus improved. For example, in Genstat 24 there is a new menu system delivering a complete pipeline for the design, data management, analysis, and reporting of variety trials.
5 - Reproducible and Repeatable
Reproducibility: the ability to re-generate the exact same results of a statistical analysis using the original data
Repeatability: the ability to apply the exact same statistical analysis to a new set of data
Good scientific practice demands reproducible research practices. Thus, we need the ability to recreate the results of our statistical analysis. Furthermore, as analysts, we may need to re-run our analysis in order to extract additional output or repeat it on an updated or new data set. Consequently, the ability to easily save a reproducible and repeatable audit trail of our analysis is essential.
What does Genstat offer?
Not only does Genstat record a full audit trail, but its powerful programming language also enables tasks to be reproduced, repeated and automated. In Genstat 24, we’ve introduced a new bookmarking feature to help trace a particular structure through a Genstat programme.

With these enhancements and additions, Genstat solidifies its position as a powerful and user-friendly tool for conducting statistical analyses, enabling researchers and analysts to extract valuable insights from their data more efficiently and effectively.

Ready to explore the Genstat? Get a Quote or Contact Us to request a free trial.
Popular


Related Reads